Consulting Tools: For Strategic Analysis

Frameworks and Tools for you to analyse your business better

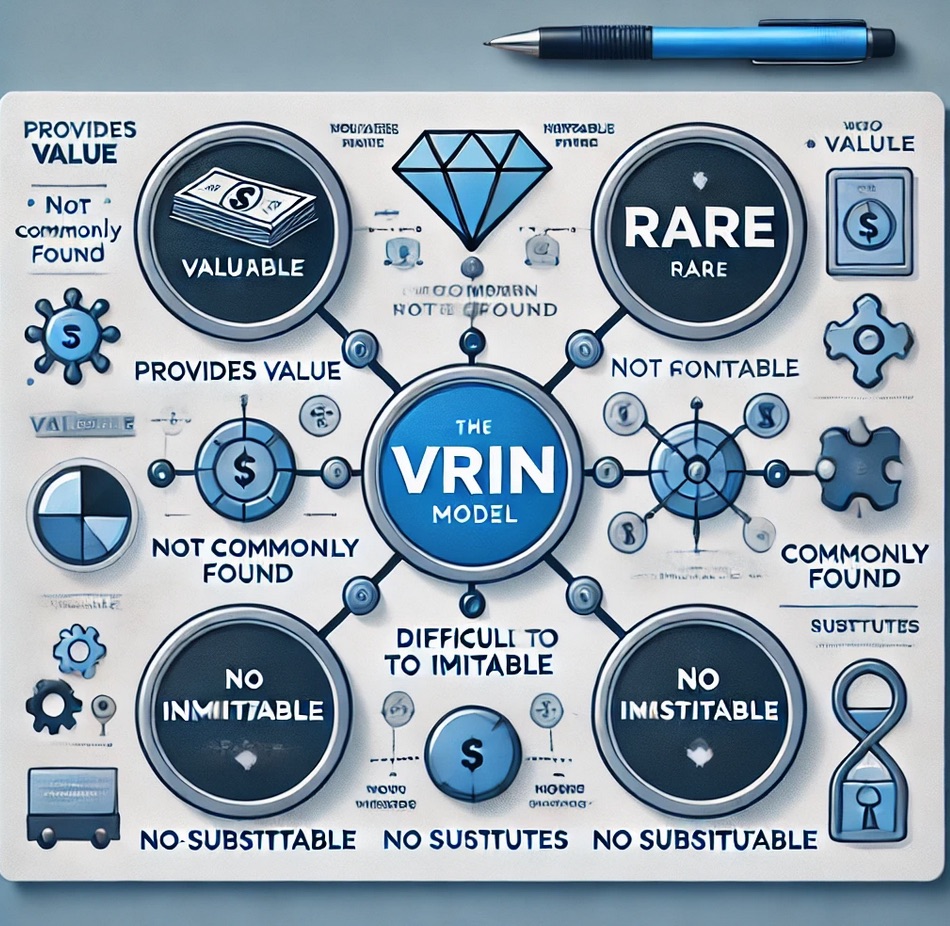
VRIN model

The VRIN model is a strategic management tool used to evaluate a firm’s resources and capabilities to determine their potential for creating a sustainable competitive advantage. VRIN stands for Valuable, Rare, Inimitable, and Non-substitutable, which are the four criteria used to assess the strategic importance of resources. Here’s a detailed overview of each criterion:

  1. Valuable: A resource must provide value to the firm by enabling it to exploit opportunities or neutralize threats in the market. Valuable resources contribute to improved efficiency and effectiveness, leading to higher profitability.
  2. Rare: A resource must be scarce relative to demand. If a resource is widely available, it cannot provide a competitive advantage. Only resources that are unique or rare within the industry can offer this potential.
  3. Inimitable: A resource must be difficult or costly for competitors to imitate. This could be due to unique historical conditions, causal ambiguity (where the cause of a resource’s effectiveness is unclear), or social complexity (such as interpersonal relationships and company culture).
  4. Non-substitutable: There must be no strategically equivalent valuable resources that are themselves either not rare or imitable. This means that the resource cannot be replaced by another resource that can provide the same value.

Application of the VRIN Model

The VRIN model is typically used in the following steps:

  1. Identify Key Resources and Capabilities: List the firm’s resources and capabilities.
  2. Evaluate Each Resource Against VRIN Criteria: Assess whether each resource is valuable, rare, inimitable, and non-substitutable.
  3. Strategic Implications: Determine which resources and capabilities can be leveraged for sustained competitive advantage.
  4. Resource Management: Develop strategies to protect, develop, and leverage these key resources.

Example

Consider a tech company with a unique software algorithm.

  • Valuable: The algorithm significantly improves processing speeds, providing a better user experience.
  • Rare: No other company has developed a similar algorithm.
  • Inimitable: The complexity of the algorithm and the expertise required to develop it make it difficult for competitors to replicate.
  • Non-substitutable: There are no other algorithms or technologies that can match its performance and efficiency.

Similar Tools and Methodologies

  1. SWOT Analysis: This tool analyzes the Strengths, Weaknesses, Opportunities, and Threats of a company. While VRIN focuses on internal resources, SWOT includes both internal and external factors.
  2. Porter’s Five Forces: This framework assesses industry structure and competitive intensity to determine profitability potential. It complements VRIN by evaluating external industry forces rather than internal resources.
  3. Resource-Based View (RBV): This broader perspective focuses on the strategic management of a firm’s resources. VRIN is often considered a key component within the RBV framework.
  4. Core Competencies: Identifies a firm’s unique strengths that provide competitive advantages. Similar to VRIN, but with a focus on the integration of resources and capabilities.
  5. Value Chain Analysis: Examines the internal activities of a firm to understand the sources of value creation. This method can highlight valuable resources in the context of the firm’s overall operations.

By utilizing the VRIN model alongside these complementary tools and methodologies, firms can gain a comprehensive understanding of their strategic resources and how best to leverage them for sustained competitive advantage.

value net model

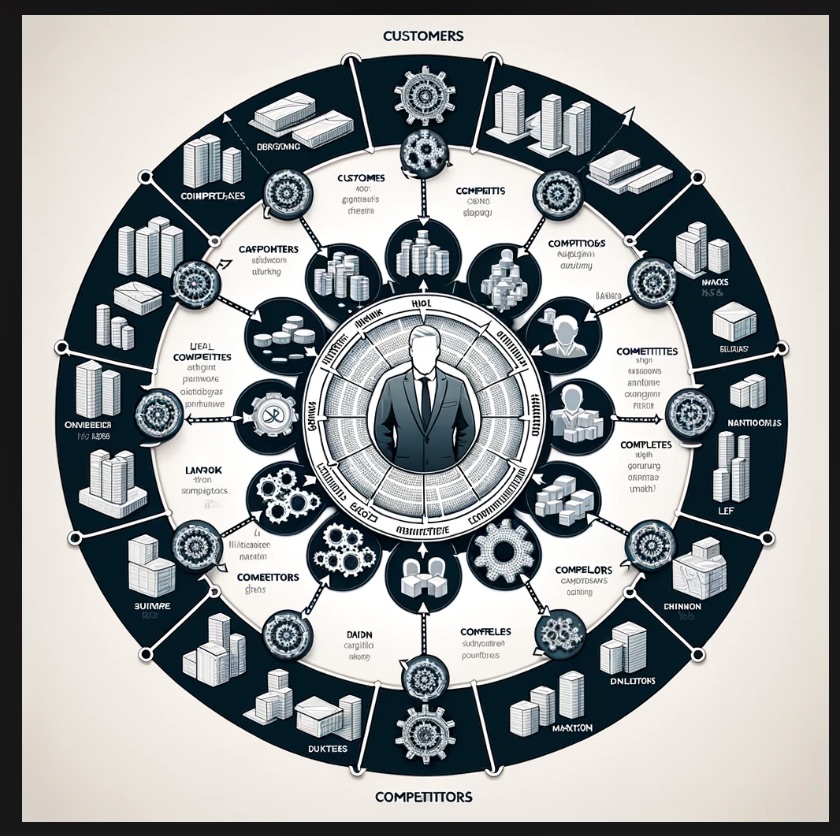
The Value Net Model, conceptualized by Adam Brandenburger and Barry Nalebuff, is a strategic analysis tool used in the field of management consulting to understand a company’s competitive environment. This model extends beyond the traditional analysis of competitors to include four key types of business relationships: customers, suppliers, competitors, and complementors. These elements are arranged in a cross-shaped diagram representing the company’s value net, a framework that helps identify and analyze the interconnections and dynamics among these groups. The model encourages organizations to view their competitors not just as rivals but also as potential partners that can add value to their business.

Key Components of the Value Net Model

  1. Customers: Individuals or organizations that buy or use the company’s products or services.
  2. Suppliers: Entities that provide the company with the inputs (goods, services, information) it needs to produce its products or services.
  3. Competitors: Companies that offer similar products or services to the same customer base.
  4. Complementors: Entities that provide complementary products or services, which, when used together with the company’s offerings, enhance the value of both.

Application in Strategic Planning

The Value Net Model is instrumental in strategic planning as it provides a comprehensive view of the competitive landscape. It helps companies identify opportunities for collaboration, co-opetition (cooperative competition), and strategic alliances. By understanding the roles of complementors and competitors, companies can explore innovative ways to create value for customers, differentiate their offerings, and achieve a competitive advantage.

Similar Tools and Methodologies

  • SWOT Analysis: A tool that helps organizations identify their Strengths, Weaknesses, Opportunities, and Threats. While the SWOT Analysis offers a broad overview of internal and external factors, the Value Net Model specifically focuses on the competitive environment.
  • Porter’s Five Forces: A framework for analyzing the level of competition within an industry and business strategy development. It focuses on five forces that shape every industry and market. Unlike the Value Net Model, it does not explicitly consider complementors.
  • Blue Ocean Strategy: A strategy that encourages companies to create new demand in an uncontested market space, or a “Blue Ocean,” rather than competing head-to-head with other companies in an existing industry. This approach complements the Value Net Model by emphasizing innovation and value creation.

In conclusion, the Value Net Model by Brandenburger and Nalebuff offers a unique perspective on strategic analysis, encouraging companies to look beyond traditional competitors and consider a wider array of relationships in their competitive strategy. This model is particularly useful for organizations looking to explore innovative strategic alliances and partnerships to enhance their competitive positioning.

Resource Based View RBV

The Resource-Based View (RBV) of the firm is a managerial framework used to determine the strategic resources available to a company. It highlights the internal environment of a firm in terms of its resources and capabilities. The main idea behind RBV is that firms possess resources, a subset of which enables them to achieve competitive advantage, and a further subset which leads to superior long-term performance. Resources that are valuable, rare, inimitable, and non-substitutable (VRIN criteria) can provide sustainable competitive advantage.

Here are the key components and implications of the RBV:

  1. Resources and Capabilities: In RBV, resources are defined as the tangible and intangible assets that a firm controls, which it can use to conceive and implement its strategies. Capabilities, on the other hand, refer to the firm’s capacity to deploy resources using organizational processes to effect a desired end. These resources and capabilities together form the basis for a firm’s strategy.
  2. Types of Resources: Resources can be tangible or intangible. Tangible resources include physical assets like buildings and equipment, while intangible resources include assets like brand reputation, patents, and the skills and knowledge of employees.
  3. Competitive Advantage: According to RBV, for resources to provide a firm with a competitive advantage, they must be valuable, rare, inimitable, and non-substitutable. This means that resources must contribute to creating value for customers, be unique to the firm, difficult for competitors to copy or acquire, and cannot be easily replaced by other resources or capabilities.
  4. Sustainability of Competitive Advantage: The RBV suggests that the sustainability of a competitive advantage depends on the barriers to imitation and the ability of competitors to substitute the critical resources. Factors such as complexity, culture, unique history, and causal ambiguity can act as barriers to imitation.
  5. Strategic Implications: RBV has several strategic implications for firms. It suggests that firms should look internally to determine their strengths and weaknesses, invest in developing unique capabilities and resources, protect and leverage those assets to create competitive advantages, and continuously evaluate and adapt their resource base in response to changing market conditions.
  6. Critiques and Limitations: While the RBV provides a robust framework for understanding competitive advantage, it has been criticized for being too inward-looking, ignoring the importance of industry structure and external market forces. Additionally, the theory assumes resource heterogeneity and immobility within an industry, which may not always be the case.

In summary, the RBV of the firm offers a perspective that emphasizes the importance of unique internal resources and capabilities in achieving and sustaining competitive advantage. It complements other strategic frameworks that focus on external factors, providing a comprehensive view of what drives firm performance.

Time based competition

Time-based competition refers to a business strategy where companies strive to outperform their competitors by bringing products and services to the market faster. This approach emphasizes speed as a critical competitive advantage, focusing on reducing the time taken for product development, production, and delivery to customers. The goal is to respond more quickly to customer needs and market changes, thereby gaining market share, increasing customer satisfaction, and potentially enjoying higher profit margins.

The concept of time-based competition can be applied across various industries, from manufacturing to technology to services. It involves several key practices, including:

  1. Rapid Product Development: Implementing agile development practices, leveraging cross-functional teams, and employing advanced technologies to accelerate product design and development processes.
  2. Efficient Production Systems: Streamlining operations through just-in-time manufacturing, lean production techniques, and process optimization to minimize production lead times.
  3. Supply Chain Management: Enhancing the efficiency of the supply chain by improving coordination with suppliers and distributors, optimizing inventory levels, and utilizing advanced logistics solutions.
  4. Customer-Focused Innovation: Quickly iterating on product designs based on customer feedback and market trends, ensuring that new offerings meet current market demands.
  5. Technology and Automation: Investing in advanced technologies such as artificial intelligence, machine learning, and automation tools to speed up operations, from manufacturing to customer service.

The benefits of time-based competition include not only faster time-to-market but also increased flexibility, improved customer responsiveness, and the ability to capitalize on market opportunities before competitors. However, it also requires significant investment in technology, training, and process re-engineering, as well as a cultural shift towards valuing speed and adaptability.

Experience Curve

The Experience Curve is a concept in business strategy that suggests the more experience a firm gains in producing a particular product or service, the lower its costs will become. This idea is grounded in the observation that operational efficiency improves over time as organizations learn and implement ways to reduce production costs and improve productivity. The Experience Curve can be considered a broader application of the learning curve, which primarily focuses on labor efficiency improvements.

Key Elements of the Experience Curve:

  • Cost Reduction: As a company produces more, it learns how to do so more efficiently, leading to a decrease in the per-unit cost of production. This reduction includes both direct costs (like materials and labor) and indirect costs (such as overhead).
  • Volume: The Experience Curve effect is strongly influenced by the volume of production. Higher volumes lead to faster learning and cost reduction.
  • Technology and Innovation: Technological advancements and innovations can steepen the Experience Curve, allowing for more rapid cost reductions as production processes improve.
  • Process Improvements: Continuous improvement methodologies, such as Lean Management, are central to accelerating the Experience Curve effect by systematically reducing waste and improving workflow efficiency.

Strategic Implications:

Organizations can leverage the Experience Curve to gain competitive advantages by:

  • Pricing Strategies: Using knowledge of cost reductions to set prices that competitors may find difficult to match.
  • Investment Decisions: Prioritizing investments in areas where the Experience Curve can be most beneficial.
  • Market Expansion: Expanding market share to accelerate down the Experience Curve, reducing costs faster than competitors.

Limitations:

  • Diminishing Returns: The rate of cost reduction can decrease as the organization matures and the easy gains are exhausted.
  • Market Changes: Shifts in market demand, technology, or competitive landscape can disrupt the Experience Curve’s trajectory.
  • Focus on Cost Reduction: An exclusive focus on cost reduction can sometimes lead to a neglect of other important factors like quality and innovation.

Similar Tools and Methodologies:

  • Lean Management: Focuses on waste reduction and value maximization across all areas of a business to improve efficiencies and reduce costs.
  • Six Sigma: Aims at improving the quality of process outputs by identifying and removing the causes of defects and minimizing variability in manufacturing and business processes.
  • Total Quality Management (TQM): An organizational approach that seeks continuous improvement in processes, products, and services, with the goal of achieving customer satisfaction and operational efficiency.
  • Benchmarking: Involves comparing business processes and performance metrics to industry bests and best practices from other companies, often to understand how to reduce costs or improve in specific areas.

Understanding the Experience Curve and how it relates to these other methodologies can help organizations strategically manage their growth, operational efficiency, and competitive positioning.

GEMcKinsey

The GE/McKinsey Matrix is a strategic tool used in business to help companies decide where to invest their resources for the best returns. Developed in the 1970s by McKinsey & Company for General Electric, the matrix is a more complex version of the BCG (Boston Consulting Group) Matrix. It is designed to evaluate business portfolios and prioritize investments among different business units.

Overview of the GE/McKinsey Matrix

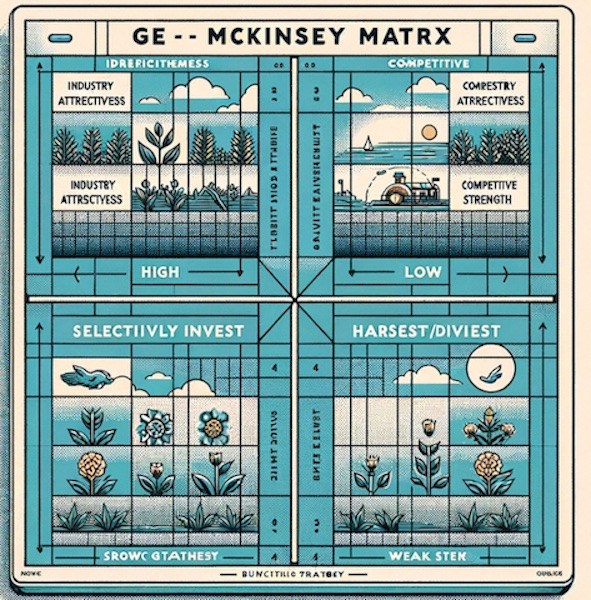
The matrix is a 3×3 grid that assesses business units on two dimensions:

  1. Industry Attractiveness: This includes factors such as market growth, market size, and profitability. It is plotted on the vertical axis, with higher positions indicating more attractive markets.
  2. Competitive Strength: This includes factors such as market share, brand strength, and product quality. It is plotted on the horizontal axis, with positions further to the right indicating stronger competitive positions.

Each business unit is placed within this matrix, allowing companies to categorize them into one of three zones:

  • Invest: Units in attractive industries with strong competitive positions are considered for further investment.
  • Selectively Invest: Units with medium industry attractiveness or competitive strength are selected for investment on a case-by-case basis.
  • Harvest/Divest: Units in unattractive industries or with weak competitive positions are considered for divestiture or for strategies to maximize short-term returns.

Application

The GE/McKinsey Matrix is particularly useful for large, diversified corporations that need to allocate resources efficiently among different business units. It helps in making strategic decisions about whether to invest, develop, or divest in particular segments of the business.

Similar Tools and Methodologies

BCG Matrix: Similar to the GE/McKinsey Matrix, the BCG Matrix categorizes business units into four categories (Stars, Cash Cows, Question Marks, and Dogs) based on market growth and market share. It is simpler and more straightforward but does not account for as many variables as the GE/McKinsey Matrix.

Ansoff Matrix: Focuses on growth strategies by considering new vs. existing products and markets. It helps businesses decide on strategies like market penetration, market development, product development, and diversification.

Porter’s Five Forces: While not a portfolio analysis tool like the GE/McKinsey Matrix, Porter’s Five Forces is crucial for analyzing industry attractiveness by evaluating competitive intensity, potential entrants, substitute products, bargaining power of suppliers, and bargaining power of customers.

PESTEL Analysis: Offers a broader view of the external environment by analyzing political, economic, social, technological, environmental, and legal factors. This can complement the GE/McKinsey Matrix by providing insights into industry attractiveness.

Implementing the GE/McKinsey Matrix requires a thorough understanding of the market and internal capabilities, making it a powerful tool for strategic decision-making in complex business landscapes.

kirana store strategy

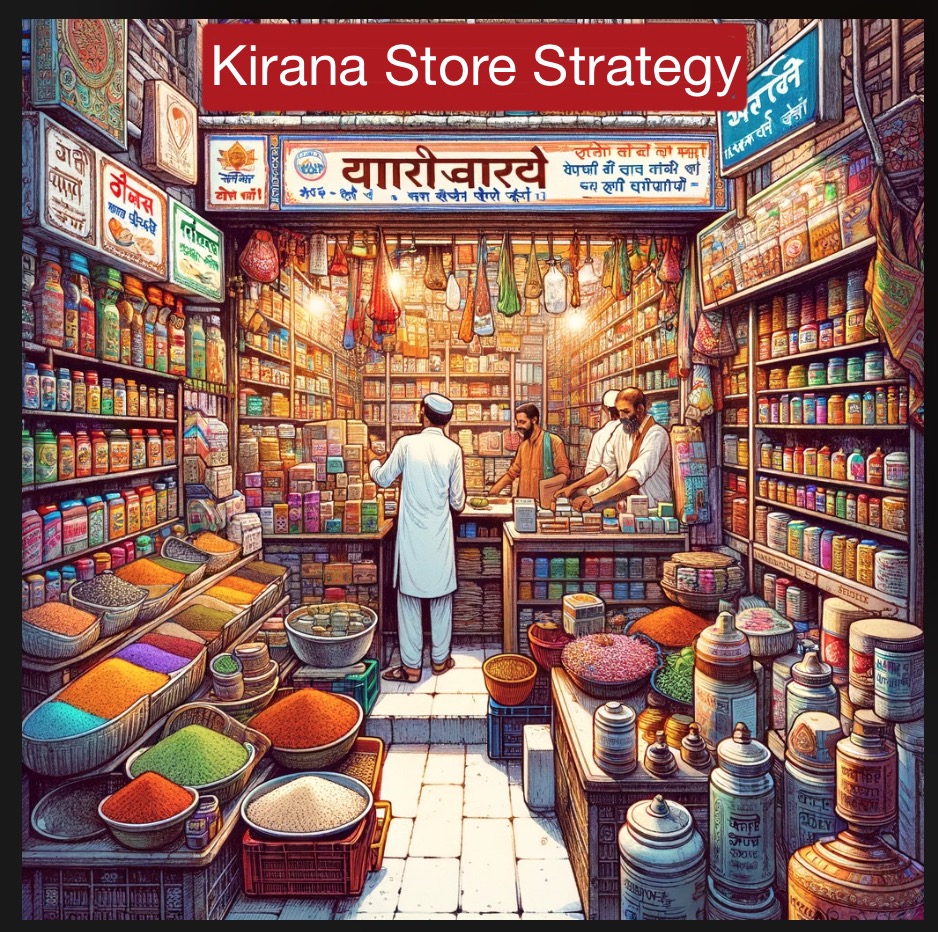
“Kirana Store strategy” or  “Grocery Store Strategy,” is a highly tactical, short-term approach to retail operations, particularly in the grocery segment. This strategy emphasizes breadth over depth in product offerings, prioritizes immediate sales over long-term brand or category development, and leverages pricing flexibility to drive transactions. This strategy is not limited to retail, but seen used widely by many businesses especially services sector. While innovative, it presents several challenges and opportunities within a retail context. Here’s a more detailed analysis:

Overview of Grocery Store Strategy

Core Characteristics:

  • Broad Product Assortment with Limited Stock: Aims to attract a wide customer base by offering a diverse range of products but keeps inventory levels low to reduce holding costs.
  • Short-term Focus: Lacks a long-term strategic vision, concentrating instead on immediate sales and revenue generation through quick inventory turnover.
  • Commission-based Sales: Employs a sales model that rewards volume, incentivizing staff to push for more sales without necessarily considering long-term customer loyalty or brand equity.
  • Dynamic Pricing and Bargaining: Adopts flexible pricing strategies, including bargaining with customers and frequent price cuts, to stimulate demand and compete on price.

Strategic Implications

Advantages:

  • Can quickly adapt to changing market trends due to low inventory levels and a broad product range.
  • May appeal to price-sensitive customers or those looking for deals.
  • Lowers risk associated with unsold inventory due to minimal stock holding.

Challenges:

  • Difficulty in building customer loyalty as the focus shifts away from brand or product consistency to price competition.
  • May struggle to achieve sustainable profit margins due to constant price cuts and lack of focus on higher-margin products or services.
  • Operational complexity in managing a wide range of products, each with different demand patterns and supplier relationships.
  • Short-term sales focus might neglect the potential benefits of investing in long-term customer relationships and brand value.

Similar Tools and Methodologies

While the “Grocery Store Strategy” is unique, several existing retail and business strategies share some characteristics or offer alternative approaches:

  1. High-Velocity Retailing: Focuses on rapid turnover of merchandise with a keen eye on trend responsiveness, somewhat similar to the broad product strategy but with a more strategic approach to inventory management and supplier relationships.
  2. Flash Sales Model: Uses limited-time offers to drive traffic and sales, relying on price cuts and urgency but typically within a more defined strategic framework.
  3. Loss Leader Strategy: Involves selling selected items below cost to attract customers, hoping they’ll purchase other higher-margin products, a tactic that shares the price flexibility aspect.
  4. Blue Ocean Strategy: While not directly comparable, it encourages businesses to find new market spaces (blue oceans) where competition is irrelevant, contrasting with the highly competitive, price-driven approach of the Grocery Store Strategy.

In conclusion, while the “Grocery Store Strategy” offers an innovative approach to retailing, it’s important for businesses to consider the long-term implications of such a strategy on brand equity, customer loyalty, and sustainable growth. Alternatives or complementary strategies may provide a more balanced approach to achieving both short-term sales targets and long-term business objectives.

Strategy boffins team has come up with Kirana store or Grocery store strategy

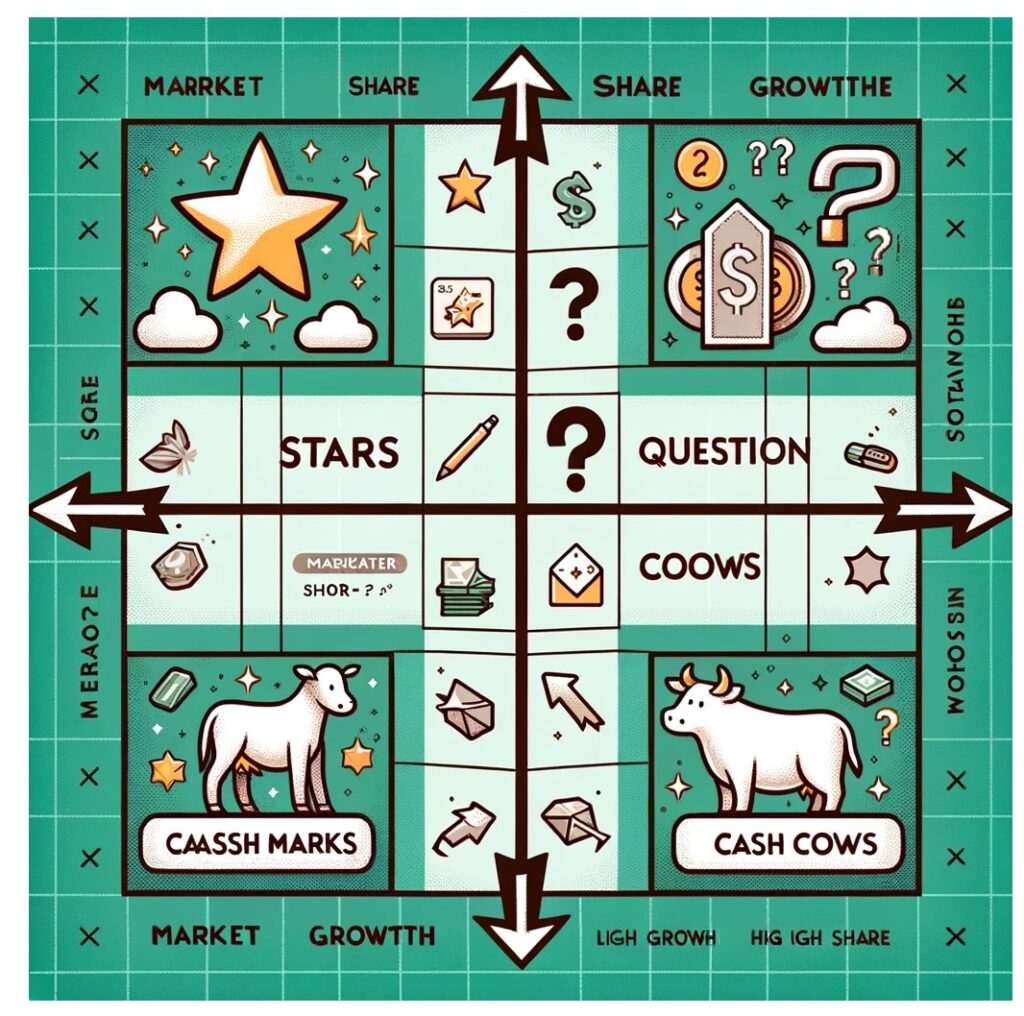
BCG Matrix e1706927751378

The BCG matrix, also known as the Growth-Share matrix, is a strategic planning tool developed by the Boston Consulting Group in the 1970s. It is used by businesses to evaluate the relative performance of their product portfolio based on market growth and market share. The matrix categorizes products into four quadrants:

  1. Stars: High market growth, high market share. These are leading products in fast-growing markets that require significant investment to maintain their position but have the potential for substantial returns.
  2. Question Marks: High market growth, low market share. These products are in growing markets but have a low market share. They require substantial investment to increase market share, and management must decide whether to invest or divest.
  3. Cash Cows: Low market growth, high market share. These are mature, successful products with little need for investment. They generate more cash than is required to maintain their market share and fund the company’s growth products.
  4. Dogs: Low market growth, low market share. Products in this quadrant generate just enough cash to maintain themselves but do not have much potential for growth. Often, the strategy is to divest these products.

Strategy Implications

The BCG matrix helps companies in allocating resources and strategizing for each product or business unit. The aim is to have a balanced portfolio of Stars (for future growth), Cash Cows (for current profits), and a minimal number of Question Marks and Dogs. The matrix encourages organizations to:

  • Invest in Stars to maintain their leading position as long as the market grows.
  • Evaluate Question Marks carefully, investing in those with the potential to become Stars and divesting others.
  • Harvest Cash Cows to support investment in Stars and promising Question Marks.
  • Divest Dogs, as they are unlikely to generate significant profits or growth.

Similar Tools and Methodologies

Other strategic planning tools and methodologies that offer alternative or complementary insights include:

  • Ansoff Matrix: Focuses on growth strategies by varying product offerings and market presence.
  • Porter’s Five Forces: Analyzes industry competitiveness and the potential profitability of a market.
  • PESTEL Analysis: Examines external factors (Political, Economic, Social, Technological, Environmental, and Legal) that can affect an organization’s success.
  • SWOT Analysis: Identifies Strengths, Weaknesses, Opportunities, and Threats related to business competition or project planning.
  • McKinsey 7S Framework: Analyzes internal organizational effectiveness by examining seven key elements (strategy, structure, systems, shared values, skills, style, and staff).

These tools can be used in conjunction with the BCG matrix to provide a more comprehensive view of a company’s strategic position and potential directions for growth and optimization.

value chain

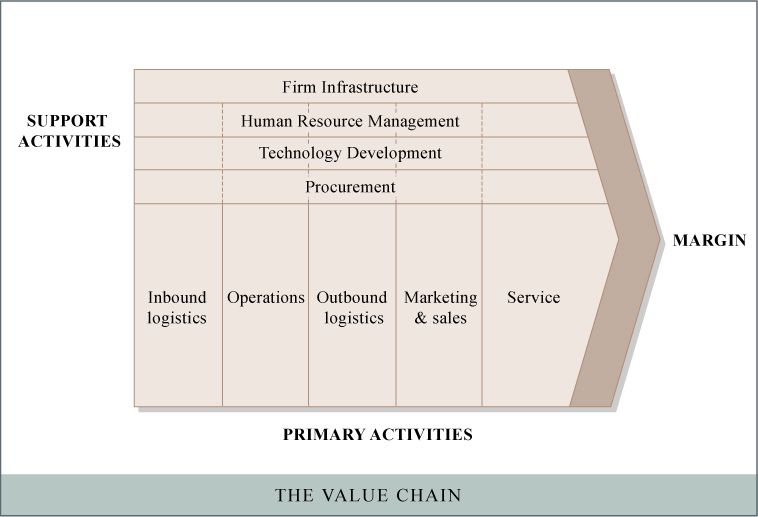
Value Chain Analysis is a strategic tool used to analyze internal company activities. Its goal is to understand how various parts of a business create a product or service valuable to its customers. By examining each step of the value chain, a company can identify ways to increase efficiency, improve quality, and create the best customer experience, ultimately leading to competitive advantage.

The concept was popularized by Michael Porter and includes primary and support activities:

  1. Primary Activities:
    • Inbound Logistics: Receiving, storing, and distributing inputs of the product.
    • Operations: Processes of transforming inputs into the final product form.
    • Outbound Logistics: Storing and distributing the final product to customers.
    • Marketing and Sales: Activities to enhance buyer’s awareness and persuade them to purchase.
    • Service: Post-sale services, including installation, repair, and customer support.
  2. Support Activities:
    • Procurement: Acquisition of resources, services, and materials.
    • Technology Development: Includes R&D, process automation, and other technology development to support the value chain.
    • Human Resource Management: Recruiting, hiring, training, and development of employees.
    • Firm Infrastructure: Company-wide activities such as finance, legal, quality management, and strategic planning.

By analyzing these activities, organizations can understand where they can create value and what could be improved. It’s not just about cutting costs; it’s about optimizing and aligning activities to deliver the highest possible value to customers.

Similar Tools and Methodologies:

  • SWOT Analysis: Helps in identifying internal strengths and weaknesses, and external opportunities and threats, which can be related to different parts of the value chain.
  • Balanced Scorecard: Provides a more comprehensive view of organizational performance, including financial, customer, internal processes, and learning and growth perspectives that intersect with various elements of the value chain.
  • Lean Management: Focuses on eliminating waste within processes, highly relevant for optimizing operations in the value chain.
  • Supply Chain Management: While Value Chain Analysis is focused internally, Supply Chain Management expands the scope to include external links with suppliers and distributors, which is crucial for optimizing inbound and outbound logistics.

Using Value Chain Analysis in conjunction with these tools can provide a holistic view of a company’s operations and help in creating a competitive edge by maximizing value creation and minimizing costs.

Management by Objectives MBO

Management by Objectives (MBO) is a strategic management model that aims to improve the performance of an organization by clearly defining objectives agreed to by both management and employees. Developed by Peter Drucker in the 1950s, MBO focuses on setting and achieving measurable goals aligned with the overall objectives of the organization.

Key Elements of MBO:

  1. Goal Setting: Goals are set collaboratively by managers and employees, ensuring that objectives are realistic and achievable, yet challenging.
  2. Specific Objectives: The objectives set under MBO are specific, clear, and measurable, which helps in evaluating performance against these objectives.
  3. Organizational Alignment: Objectives are aligned with the organization’s vision and strategic goals, ensuring that every individual’s efforts contribute to the larger organizational aims.
  4. Periodic Review and Feedback: Regular reviews and feedback sessions are a crucial part of MBO, allowing for adjustments in objectives and realignment of efforts as necessary.
  5. Performance Evaluation: At the end of the MBO cycle, performance is evaluated based on the achievement of the set objectives.

Application in Management Consulting:

  • Performance Improvement: MBO can be used to enhance individual and team performance by aligning their goals with organizational objectives.
  • Strategic Planning: It aids in the implementation of strategic plans by breaking down strategic objectives into actionable individual goals.
  • Employee Engagement: The collaborative nature of goal setting in MBO can lead to increased employee engagement and motivation.

Similar Tools and Methodologies:

  • OKRs (Objectives and Key Results): Similar to MBO, OKRs also focus on setting and achieving goals. However, OKRs often encourage setting more ambitious goals and involve a higher level of transparency and alignment across the organization.
  • Balanced Scorecard: While MBO focuses on objectives and performance evaluation, the Balanced Scorecard adds more dimensions by including financial, customer, internal process, and learning and growth perspectives.
  • KPIs (Key Performance Indicators): These are specific metrics used to measure performance. While KPIs are often a part of MBO, they are more focused on measurement and less on collaborative goal setting.
  • Hoshin Kanri (Policy Deployment): A more holistic approach to aligning the organization’s strategic objectives with specific improvement projects and operational activities.

MBO provides a structured approach to goal setting and performance management, making it particularly valuable in contexts where clear objectives and measurable outcomes are essential. It emphasizes the importance of joint planning and goal setting, which can enhance employee motivation and engagement.